

Series 3 Intel® Core™ Ultra Mobile Processor Competitive
Designed to deliver leading AI experiences, Series 3 Intel® Core™ Ultra mobile processors provide exceptional performance in an extremely thin and light laptop. Beyond providing a powerful performance, these processors are efficient and offer long-lasting battery life to users on the go.

With some SKUs featuring built-in Intel® Arc™ GPUs, Series 3 Intel® Core™ Ultra processors feature the technology to support gamers and creators alike. Plus, these processors offer a wide range of systems to support various user needs and provide different options, all of which include incredible connectivity capabilities.
In this training, we’ll compare the performance of Series 3 Intel® Core™ Ultra mobile processors against other AI-accelerated mobile processors, such as AMD and Qualcomm, to see which provides the best performance across workloads.
VS.




Summary
Built to accelerate workloads, Intel® Core™ Ultra Series 3 mobile processors boost performance across productivity, content creation, and gaming tasks! When tested against competitors like AMD and Qualcomm, the Series 3 mobile processors consistently provided better performance.
Recommend Series 3 Intel® Core™ Ultra mobile processors to customers who want reliable performance, built-in AI capabilities, and efficient power for everyday productivity, content creation, and gaming.
TAKE THE QUIZ
Materials are Intel Confidential. For Retail Sales Professional training only. Do not repurpose or reuse without permission.
Performance varies by use, configuration and other factors. Learn more at www.intel.com/PerformanceIndex.
Performance results are based on testing as of dates shown in configurations and may not reflect all publicly available security updates.
Configurations
Tested December 2025
Processor: Intel® Core™ Ultra X9 processor 388H (Panther Lake) PL1=45W; tested in Intel reference platform; Memory: 32GB LPDDR5 9600; Storage: Samsung PM9A1 512GB; Display Resolution: 2880x1800; OS: Windows 11 26200.6725; Graphics Driver: Intel® Arc™ Graphics Pre-Production driver; NPU Driver: Pre-Production driver; BIOS: Pre-Production BIOS; Power Plan set to Balanced, Power Mode set to "Best Performance".
Processor: Intel® Core™ Ultra 9 processor 285H (Arrow Lake) PL1=45W; tested in Intel reference platform; Memory: 64GB DDR5 6400; Storage: Samsung PM9A1 512GB; Display Resolution: 1920x1200; OS: Windows 11 26200.6725; Graphics Driver: 32.0.101.8132; NPU Driver: 32.0.100.4404; BIOS: MTLPFWI1.R00.5385; Power Plan set to Balanced, Power Mode set to "Best Performance".
Processor: Intel® Core™ Ultra X9 processor 388H (Panther Lake); tested in Lenovo IdeaPad reference design with sustained PL1=65W; Memory: 32GB LPDDR5 9600; Storage: Samsung 9100 Pro 1 TB; Display Resolution: 2.8k; OS: Windows 11 26200.7171; Graphics Driver: Intel® Arc™ Graphics Pre-Production driver; NPU Driver: Pre-Production driver; BIOS: Pre-Production BIOS; Power Plan set to Balanced, Power Mode set to "Best Performance"; Lenovo Vantage = Performance. Battery Size: 99.9Whr
Processor: Intel® Core™ Ultra X7 processor 358H (Panther Lake); tested in MSI Prestige 14; Memory: 32GB LPDDR5 9600; Storage: Samsung 9100 Pro 1 TB; Display Resolution: 2.8k; OS: Windows 11 26200.7171; Graphics Driver: Intel Arc Graphics Pre-Production driver; NPU Driver: Pre-Production driver; BIOS: Pre-Production BIOS; Power Plan set to Balanced, Power Mode set to "Best Performance"; MSI Center = Performance. Battery Size: 78.6Whr
Processor: AMD Ryzen AI 9 HX 370 (Strix Point); tested in ASUS Vivobook S 15; Memory: 32GB LPDDR5 7500; Storage: Samsung 9100 Pro 1 TB; Display Resolution: 2880x1620; OS: Windows 11 26200.7171; Graphics Driver: 32.0.22029.1019; NPU Driver: 32.0.203.314; BIOS: M5506WA.314; Power Plan set to Balanced, Power Mode set to "Best Performance"; MyAsus= Performance. Battery Size: 75Whr
Processor: AMD Ryzen AI 9 365 (Strix Point); tested in ASUS Zenbook S 16; Memory: 32GB LPDDR5 7500; Storage: Samsung 9100 Pro 1 TB; Display Resolution: 2880x1800; OS: Windows 11 26200.7171; Graphics Driver: 32.0.22029.1019; NPU Driver: 32.0.203.314; BIOS: UM5606WA.319; Power Plan set to Balanced, Power Mode set to "Best Performance"; MyAsus= Performance. Battery Size: 78Whr
Processor: Qualcomm X Elite X1E-84-100; tested in Samsung Galaxy Book4 Edge; Memory: 16 GB; Storage: 1 TB; Display Resolution: 1920x1080; OS: Windows 11 Home 26200.7171; Graphics Driver: 31.0.121.1; NPU Driver: 30.0.145.1000; BIOS: Samsung P00AKX.061.250718.WY.1810 ; Power Plan set to Balanced, Power Mode set to "Best Performance"; Battery Size: 60.5Whr
Benchmarks
CrossMark: This benchmark measures practical, real-world PC performance for the CrossMark is a benchmark from the BAPCo consortium that is an easy to run native cross-platform benchmark that measures the overall system performance and system responsiveness using models of real -world applications.
WebXPRT 4: This browser benchmark compares the performance of almost any web-enabled device. It contains six HTML5- and JavaScript-based scenarios created to mirror the tasks you do every day: photo enhancement, organize an album using artificial intelligence (AI), stock -option pricing, encrypting notes and optical character recognition (OCR) scans, sales graphs, and online homework.
Speedometer: Speedometer is a browser benchmark that measures the responsiveness of Web applications. It uses demo web applications to simulate user actions such as adding to-do items.
3DMark Time Spy (Graphics): Time Spy is a DirectX 12 benchmark test for gaming PCs running Windows 10. With its pure DirectX 12 engine, built from the ground up to support new API features like asynchronous compute, explicit multi -adapter, and multi-threading, Time Spy is the ideal benchmark for testing the DirectX 12 performance of modern graphics cards. The graphics sub-score specifically measures the performance of the graphics processing unit.
3DMark Solar Bay Unlimited – Graphics Score: 3DMark Solar Bay is a cross-platform benchmark for ray tracing capable Windows and Android devices. Use Solar Bay to test and compare the graphics performance of the latest high-end phones, tablets, and lightweight PCs. The graphics sub-score specifically measures the performance of the graphics processing unit.
Cinebench 2024 utilizes the power of Redshift, Cinema 4D's default rendering engine, to evaluate your computer's CPU and GPU capabilities.
Geekbench 6 measures your processor's single-core and multi-core power, for everything from checking your email to taking a picture to playing music, or all of it at once.
Procyon office productivity benchmark from UL Solutions uses Microsoft Office applications to measure Windows PC and Apple Mac performance in office productivity tasks. The benchmark workloads are built on relevant, real-world tasks using Microsoft Word, Excel, PowerPoint and Outlook.
Procyon Video Editing (GPU Accelerated): The Procyon Video Editing Benchmark uses Adobe Premiere Pro in a typical video editing workflow. Exporting video files from Premiere Pro is dead time to a creator. Even short videos can take several minutes to export. Longer sequences with layers, color grading and complex effects may take an hour or longer. A faster creator PC takes less time to export video files, giving more time back to the creator. The benchmark starts by importing two video project files. The project timelines include various edits, adjustments and effects. The second project uses several GPU-accelerated effects. Each video project is exported in Full HD encoded with H.264 and again in 4K UHD encoded with HEVC (H.265). The benchmark score is based on the time taken to export all four videos.
UL Procyon Photo Editing Benchmark: The Procyon photo editing benchmark from UL Solutions uses real-world applications to test performance. This multi-platform benchmark measures Windows PC and Apple Mac computer performance using Adobe Lightroom Classic and Adobe Photoshop in a typical photo editing workflow that includes batch processing and image retouching. v2.10.2031 (Photoshop 27.0, Lightroom Classic 14. 5.1)
UL Procyon Battery Life: The UL Procyon Battery Life Benchmark measures a device's battery life by running real -world applications and scenarios until the battery is depleted, producing a score in hours and minutes for each scenario.
Procyon Computer Vision: The Procyon AI Computer Vision Benchmark gives insights into how AI inference engines perform on your Windows PCor Apple Mac, helping you decide which engines to support to achieve the best performance. The benchmark features several AI inference engines from different vendors, with benchmark scores reflecting the performance of on-device inferencing operations. In the benchmark, common machine-vision tasks are executed using a range of popular, state-of-the-art neural networks.
Procyon AI Image Generation: The Procyon AI Image Generation Benchmark provides a consistent, accurate, and understandable workload for measuring the inference performance of on-device AI accelerators. This benchmark was developed in partnership with multiple key industry members to ensure it produces fair and comparable results across all supported hardware. The benchmark includes three tests for measuring the performance from low power NPUs to high-end discrete graphics cards. The Stable Diffusion XL (FP16) test is our most demanding AI inference workload, and only the latest high-end GPUs meet the minimum requirements to run it. For moderately powerful discrete GPUs, we recommend the Stable Diffusion 1.5(FP16) test. Finally, we designed the Stable Diffusion 1.5 (INT8) test for low power devices using NPUs for AI workloads.
Procyon AI Text Generation: The Procyon AI Text Generation Benchmark provides a more compact and easier way to repeatedly and consistently test AI performance with multiple LLM AI models. We worked closely with many AI software and hardware leaders to ensure our benchmark tests take full advantage of the local AI accelerator hardware in your systems.
Geekbench AI: is a cross-platform AI benchmark that uses real-world machine learning tasks to evaluate AI workload performance. Geekbench AImeasures your CPU, GPU, and NPU to determine whether your device is ready for today's and tomorrow's cutting-edge machine learning applications.
PugetBench for Creators: PugetBench runs directly on the host application, instead of relying on artificial or synthetic workloads, to give the most real-world results possible. It is a good way to ensure that your system is running as expected, with no abnormal showdowns or issues. Includes support for Adobe Photoshop, Adobe Premiere Pro, and BlackMagic DaVinci Resolve Studio, Adobe Lightroom Classic, Adobe After Effects. Versions tested: Lightroom Classic (v.1.0.0, harness 1.4.19, LrC 15.0.1), Premiere Pro (v.2.0.5 beta, harness 1.4.19, Pr Pro 25.6.3), After Effects (v1.0.1, harness 1.4.13, After Effects 25.6), DaVinci Resolve Studio (v.2.0.6-beta, harness 1.4.19, DaVinvi Resolve Studio 20.3), Photoshop (v1.0.5, harness 1.4.13,Photoshop 27.0)
Games Tested
Measured by Intel December 2025
- League of Legends
- Rocket League
- Baldur's Gate 3
- The Last of Us Part II
- Roblox
- Fortnite
- Red Dead Redemption 2
- PUBG: Battlegrounds
- Resident Evil 4
- Battlefield 6
- F1 25
- Ghostrunner 2
- Overwatch 2
- Dying Light: The Beast
No product or component can be absolutely secure.
Your costs and results may vary.
Intel technologies may require enabled hardware, software, or service activation.
© Intel Corporation. Intel, the Intel logo, and other Intel marks are trademarks of Intel Corporation or its subsidiaries. Other names and brands may be claimed as the property of others.
Previous Gen Performance Comparisons
Intel® Core™ Ultra Series 3 mobile processors perform great when tested against competitors, but also when tested against the previous generation of Intel® Core™ Ultra processors. Offering the latest technologies and advanced features, Intel® Core™ Ultra X9 processor 388H processors offer a boost in performance across AI, graphics, and gaming workloads.
VS.
Intel® Core™ Ultra X9 processor 388H

75%
Better Graphics Performance

53%
Better AI GPU Performance

76%
Better Gaming Performance

27.1
Hours of Battery Life
See Notices & Disclaimers for additional information.

AMD vs. Intel
Let’s see how the Intel® Core™ Ultra X9 processor 388H performs when tested against the AMD Ryzen AI 9 HX 370 processor across content creation, gaming, and battery life.
AMD Ryzen AI 9 HX 370 processor
VS.
Intel® Core™ Ultra X9 processor 388H

14%
Better Web Browsing Performance Speedometer 3.1 – Chrome

12%
Better Office Productivity Performance Procyon Office Productivity Overall

58%
Better Video Editing Performance Adobe Premiere Pro GPU Accelerated
32%
Better AI workloads Performance Procyon Al Computer Vision Benchmark (NPU int8)
17.5
Hours of Battery Life
See Notices & Disclaimers for additional information.
36%
Better with Adobe Premiere Pro
34%
Better with Adobe After Effects
34%
Better with Adobe Lightroom
62%
Better with DaVinci Resolve
Gaming Performance
The Intel® Core™ Ultra X9 processor 388H with an Intel® Arc™ B390 GPU outperformed the AMD Ryzen AI 9 HX 370 processor with a Radeon 890M GPU across the board in many popular video games.
The Intel® Core™ Ultra X9 processor 388H with an Intel® Arc™ B390 GPU performed up to:

27%
Higher FPS in League of Legends

43%
Higher FPS in Rocket League

53%
Higher FPS in Baldur’s Gate 3

58%
Higher FPS in The Last of Us Part II

59%
Higher FPS in Roblox

62%
Higher FPS in Fortnite

67%
Higher FPS in Red Dead Redemption 2

76%
Higher FPS in PUBG: Battlegrounds

81%
Higher FPS in Resident Evil 4

90%
Higher FPS in Battlefield 6

106%
Higher FPS in F1 25

120%
Higher FPS in Ghostrunner 2

144%
Higher FPS in Overwatch 2

202%
Higher FPS in Dying Light: The Beast
AMD vs. Intel
In these comparisons between the AMD Ryzen AI 9 365 processor and the Intel® Core™ Ultra X7 processor 358H, Intel consistently delivered higher performance across a range of workloads.
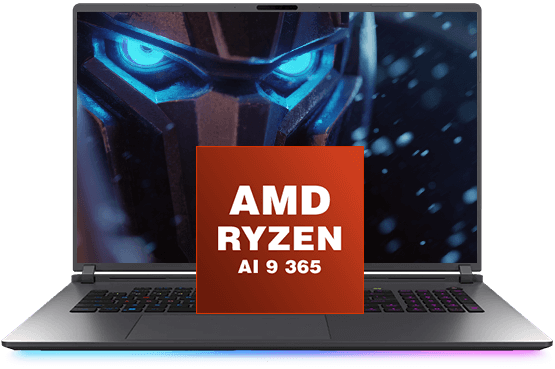
AMD Ryzen AI 9 365 processor
VS.
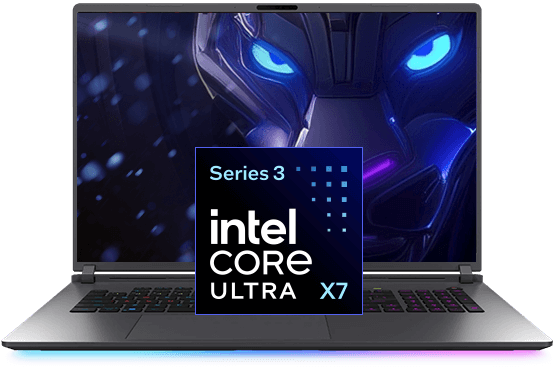
Intel® Core™ Ultra X7 processor 358H
16%
Better Web Browsing Performance Speedometer 3.1 – Chrome
9%
Better Office Productivity Performance Procyon Office Productivity Overall
37%
Better Video Editing Performance Adobe Premiere Pro GPU Accelerated
28%
Better AI workloads Performance Procyon Al Computer Vision Benchmark (NPU int8)
13.0
Hours of Battery Life
See Notices & Disclaimers for additional information.
52%
Better with Adobe Premiere Pro
40%
Better with Adobe After Effects
36%
Better with Adobe Lightroom
77%
Better with DaVinci Resolve
Qualcomm vs. Intel
Qualcomm processors, including Snapdragon X Elite, are built on ARM architecture. ARM has several drawbacks compared to the x86 architecture of Intel® processors.
Qualcomm X Elite X1E-84-100 processor
VS.
Intel® Core™ Ultra X9 processor 388H
15%
Better Web Browsing Performance WebXPRT4 – Chrome
12%
Better Office Productivity Performance CrossMark Overall Score
2.6X
Faster Video Editing Performance Adobe Premiere Pro GPU Accelerated

48%
Better Photo Editing Performance Procyon Photo Editing
3.5X
Better Graphics Performance 3DMark Time Spy Graphics Sub-Score
See Notices & Disclaimers for additional information.

Better AI Performance
Intel® Core™ Ultra X9 processor 388H is better across the board with the Procyon Al Computer Vision Benchmark.
This benchmark does not run on Qualcomm X Elite X1E-84-100 processors.